Visualize a dataset#
Visualize a dataset
The package includes basic tools to visualize BDF data as line plots. This notebook demonstrates the core functionality, including:
default plotting of a minimal dataset
custom plotting of defined quantities
adding a secondary axis to the plot
converting units in the plot
import bdf
# Read the raw source data and display the header
df = bdf.read("https://zenodo.org/records/17289383/files/SINTEF__NaCR32140-MP10-04__2025-08-25__GITT_0p05C_25degC__BioLogic.mpt")
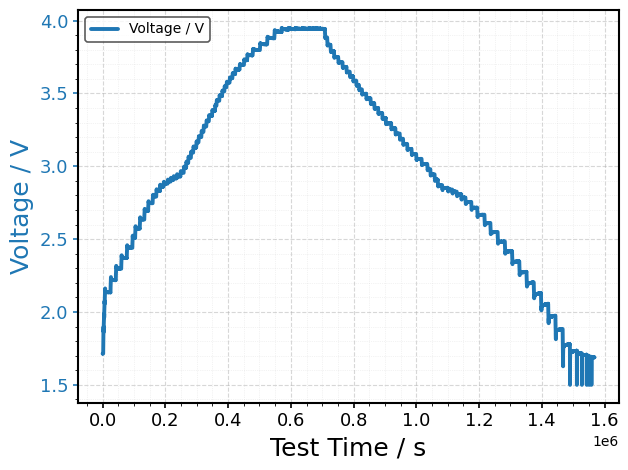
# The package plots Voltage / V versus Test Time / s by default, if no other information is provided
bdf.plot(df)
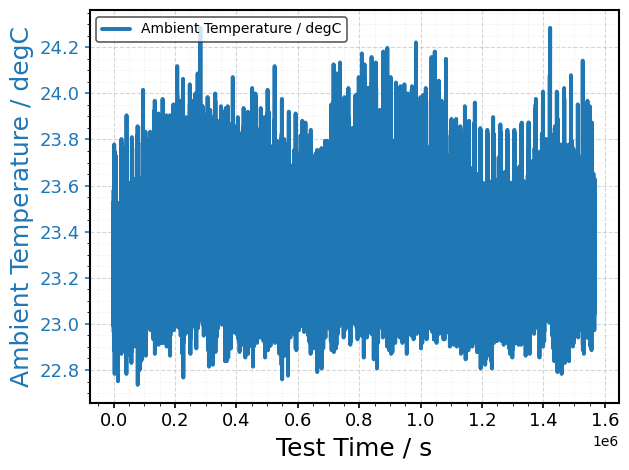
# The user can also make custom plots from the dataframe
bdf.plot(
    df,
    xdata="Test Time / s",
    ydata="Ambient Temperature / degC"
)
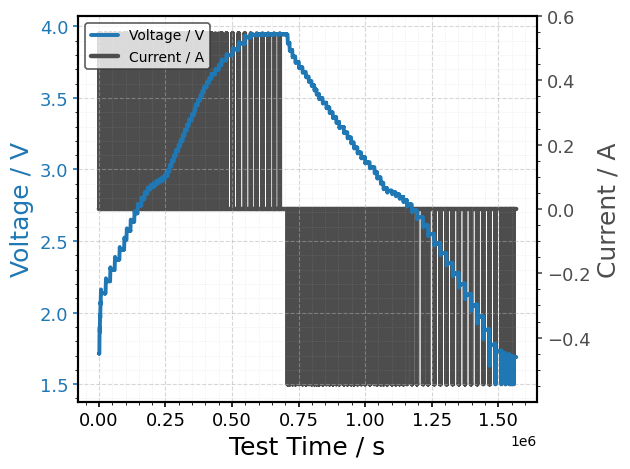
# The yydata option can be added to introduce a secondary axis
bdf.plot(
    df,
    xdata="Test Time / s",
    ydata="Voltage / V",
    yydata="Current / A"
)
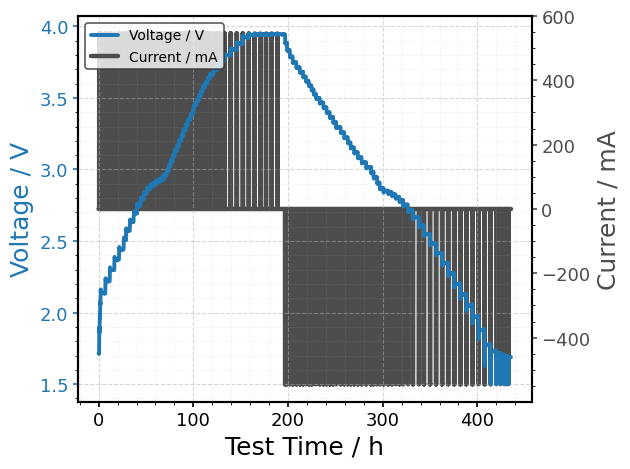
# Unit conversions can also be done directly in the plot function without additional steps
bdf.plot(
    df,
    xdata="Test Time / s", xunit="h",
    ydata="Voltage / V",
    yydata="Current / A", yyunit="mA"
)
Interactive exploration#
Use bdf.explore() for interactive plotting. Choose a backend:
backend="bokeh"(requirespip install batterydf[hvplot])backend="plotly"(included in the base install)
bdf.explore(
    df,
    xdata="Test Time / s", xunit="h",
    ydata="Voltage / V",
    yydata="Current / A", yyunit="mA",
    backend="bokeh",
    kind="scatter",
)
bdf.explore(
    df,
    xdata="Test Time / s", xunit="h",
    ydata="Voltage / V",
    yydata="Current / A", yyunit="mA",
    backend="plotly",
    kind="scatter",
)